CN

System data related with the existing intelligent dispatching, status monitoring of power transmission and transformation, intelligent decision analysis is integrated, to establish intelligent visual platform driven by data in the way of modularization, co-construction and sharing, to flexibly and vividly show the real operation status of power grid in real time, and to provide decision-making support for dispatching command and emergencies.
 Data-Driven Visualization Scenarios
Real-time update data related with 3D GIS, power grid foundation, engineering construction, real-time monitoring, emergency resources is integrated to support daily dispatching of power grid.
 Rapid Configuration of Sample Room
Complex business scenarios are abstracted into a limited number of "sample rooms". And the existing "model rooms" are simply configured to complete the visual conversion of new businesses.
 Open Framework, Co-building and Sharing
With centralized cloud deployment, companies at all levels can access it without adding new hardware, add function modules, accumulate data resources, to avoid waste of reconstruction.
 Intelligent Deduction of Power Grid Disaster
3D scenes visualize earthquake, hailstorms, fire, etc., based on AI algorithm to automatically deduce disaster evolution and intelligently push deduction information.
 Emergency Information Distribution According to Role
Based on the emergency business model of power grid, the emergency deduction process is constructed, to plot and summarize the information of different time and different regions. According to the key contents concerned by each role, information is distributed through custom interface to smoothly transmit emergency information in time and reduce useless information.
 GIS-based Visual Display
Based on GIS information such as geographic weather and power grid, the topics of power grid overview, west-east electricity transmission, operation characteristics, development strategy, dispatching system, annual operation are designed and displayed in a panoramic way, to support user interaction, and to realize situation analysis of the subject and data visualization and the accessibility and visibility of all the data.
 AI-based Human-Machine Interaction
Industrial visual AI is developed to parse natural language and obtain user's will; retrieve data and match appropriate presentation mode; and intelligently interact with users from different dimension such as text, voice and picture.
 BDV-aided Dispatching Monitoring Screen
Based on the big data visualization and centering on daily production monitoring screen, the system provides one map for dispatching monitoring screen, and provides one-stop service for convenient and in-depth acquisition of monitoring data for dispatching personnel on duty.
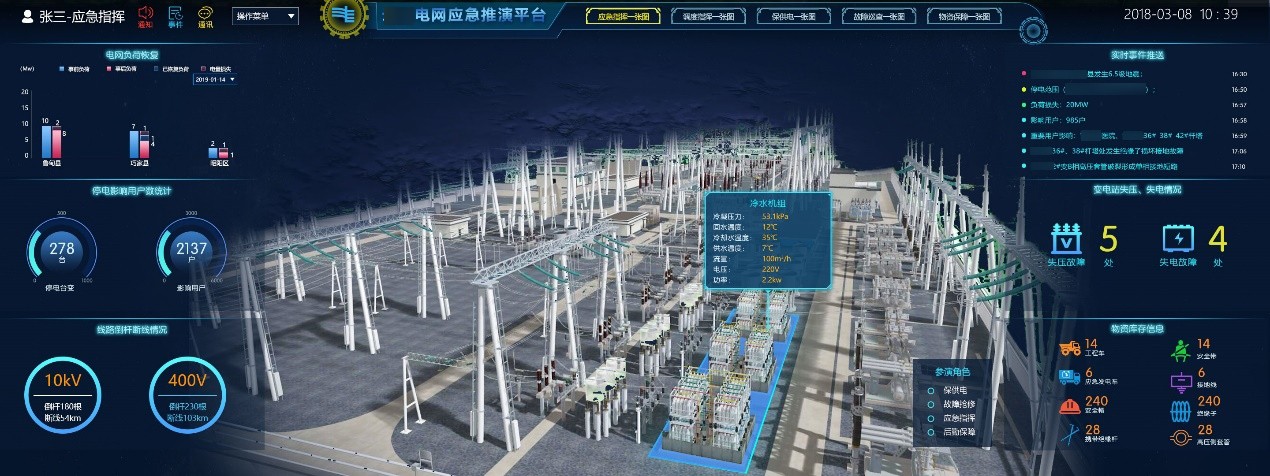
Based on the big data visualizing various expressions of power grid suffering from different disasters, the platform extracts and sorts out real-time, quantitative, intuitive and multi-dimensional information during emergency response, constructs a role-based map of emergency command and emergency disposal, so that the related personnel can integrate to the scene, making the emergency drill more real, reducing the drill cost, and improving their skills.
Singapore office: 120 Robinson Road #13-01 Singapore 068913
Office Address: Room 2110, Unit 2, Building 9, Tianfu New Valley, Wuhou District, Chengdu,Sichuan Province
Office Address:Room 1504, Unit 5, Building 11, Guojinhua Mansion, Weiyang District, Xi'an , Shanxi Province
Office Address: Room 1701, Zifang Building, 3333 Shuanglong Avenue, Jiangning District, Nanjing,Jiangsu Province